
Summary
The purpose of this article is not to be alarmist. I am simply asking for government transparency about the considerations that led to a policy of mass quarantine. The public deserves clear data demonstrating the trade offs we’re all signing up for under mass quarantine, and what we can expect going forward.
I don’t claim to be an economist, epidemiologist, or physician. But I am relatively intelligent and not afraid to share my thoughts when I have data to back up my positions. And I’ll gladly reconsider points when data makes itself available. Some of the statistics in this article might not be entirely accurate. That said, they feel sufficiently adequate to meet a Pareto threshold and draw conclusions as of March 23, 2020.
In the interest of time I’m going to posit my conclusions first, and you can read what follows to see how I landed here. When I look at the data I arrive at three takeaways:
- Given the relatively small number of predicted fatalities, more than 70% of which are accounted for by people over the age of 65, mass quarantines are a disproportionate response and do not warrant the economic damage being wrought on global economies. If continued, mass quarantines will plunge us into a depression that rivals that of the 1930s, or worse. I suggest alternatively quarantining the 65+ demographic that is most susceptible to COVID-19 to mitigate loss of life, while allowing the economy to function, ultimately avoiding a depression.
- The strategy of mass quarantines (and ‘flattening the curve’) won’t work to develop our ultimate goal of herd immunity. If global governments are to be consistent with their desires to minimize COVD-19 fatalities at all costs, mass quarantines would likely need to persist for 18-24 months until a vaccine becomes widely available (to avoid viral relapses). This timeline is economically unworkable. Accordingly, we must ‘get on with it’ to start the process of developing the sustainable solution of herd immunity.
- The restaurant industry is the leading indicator of economic collapse, and response. The industry accounts for 10% – 15% of all US employment and is most representative of the average American business: small, low margin, and too fragmented to realistically absorb any government stimulus. How our government responds to supporting small businesses will be the key determinant in how severe the ensuing recession (or depression) becomes.
If you’ve at all been economically impacted by COVID-19, or are living with economic uncertainty, sign this petition to ask that our government share their data regarding their policy of COVID-19 mass quarantine.
Life Before COVID-19: How Americans Lived with Disease Mortality
We’ll start with a bit of context.
Diseases are measured by two main metrics: CFR, short for case fatality rate, and R0, known as the basic reproductive number. In plain-speak CFR tells us what percent of the infected will die, and R0 tells us how contagious a disease is, in the number of people who can be infected from a carrier. Previous respiratory viruses SARS and MERS had CFRs of 9.6% and 34.4%, respectively, and R0s of between 2-4, and 1, respectively. The seasonal flu (influenza virus) has a CFR of 0.1% during non-pandemic years (the virus mutates and can be rather lethal during certain years) and a R0 of 1.3.
Polio didn’t have a widely accepted vaccine until 1960. Prior to the vaccine, 1% of people who contracted polio would experience paralysis, and of those up to 30% would die. Polio’s R0 is 5-7. Measles had no vaccine until 1963 and it comes with a generally accepted CFR of 0.2%. The R0 for measles is a staggering 12-18.
In fact if you look at US history over the past century, the odds of dying due to an infectious disease were nearly half a percent coming out of the first world war, with the spike in 1918 due to the Spanish flu pandemic.
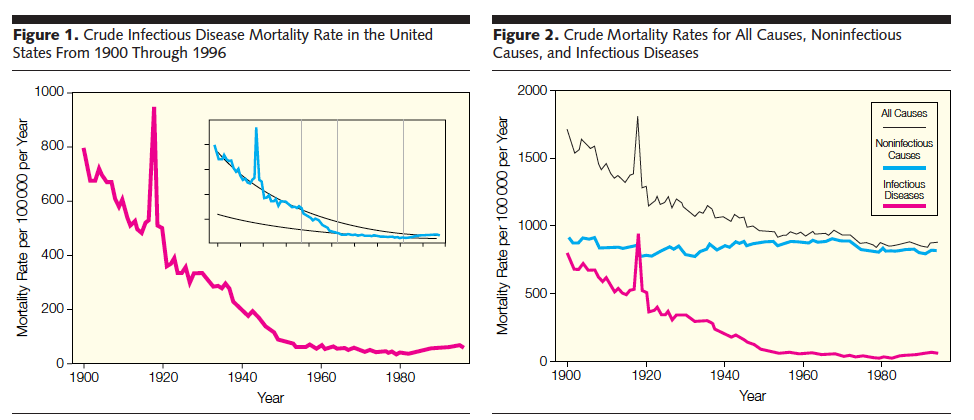
Unsurprisingly the elderly carried the highest risk of death with a 0.5% fatality rate for infectious diseases as late as the 1940’s.
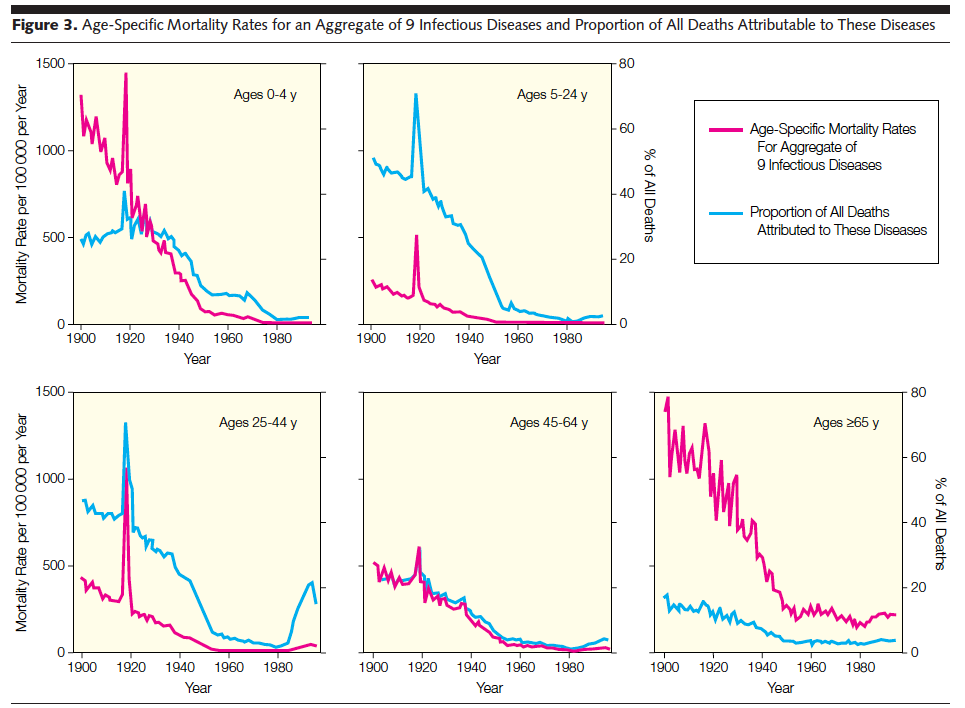
Yet our parents and grandparents lived with these risks on a daily basis. There were no economic shutdowns, no mass quarantines, and generally no change to everyday life.
Now our society is faced with a new coronavirus from China, COVID-19. We don’t have perfect data, but what we do have shows a CFR between 0.65% (South Korea) and 3.4% (broadly China) and a R0 of 2.2. Now I must stress this vigorously: we do not know the true number of infected people. This affects the denominator of the CFR calculation and can have large impacts on the actual severity of the virus. For that reason I’ll briefly explain how the math works.
The CFR, or case fatality rate, involves taking the number of deaths and dividing it by the number infected. If 3 people die out of 100 infected people, that’s a CFR of 3/100 = 3%.
But what if 1,000 people are infected and 900 of them were asymptomatic (exhibited no symptoms) or had such benign symptoms (symptoms similar to those of a seasonal cold) that they didn’t bother to get tested? Now the CFR changes; instead of dividing the 3 deaths by 100 infected we should divide by the 1,000 infected. The CFR falls precipitously to 0.3%, or about 3x more than the seasonal flu.
Because we’ve studied the flu for decades we have a much better handle on the true number of infected. We’ve only been studying COVID-19 for about 3 months. Some new data show that 86% of people infected with COVID-19 show no symptoms. Assuming this is true, and that none of those 86% die, you should immediately multiply the denominator in the COVD-19 CFR by 6.14, which is the result of dividing 86% (the number of infected people who don’t die) by 14% (the number of infected people who are included in the CFR’s current denominator) to appropriately adjust the CFR.
The adjusted CFR drops from (0.65% – 3.4%) to (0.097% – 0.55%.) Now the high end CFR for COVID-19 is starting to look reminiscent of the levels of infectious risk our parents and grandparents lived with.

Let’s summarize with a table of CFRs and R0 before we move further.
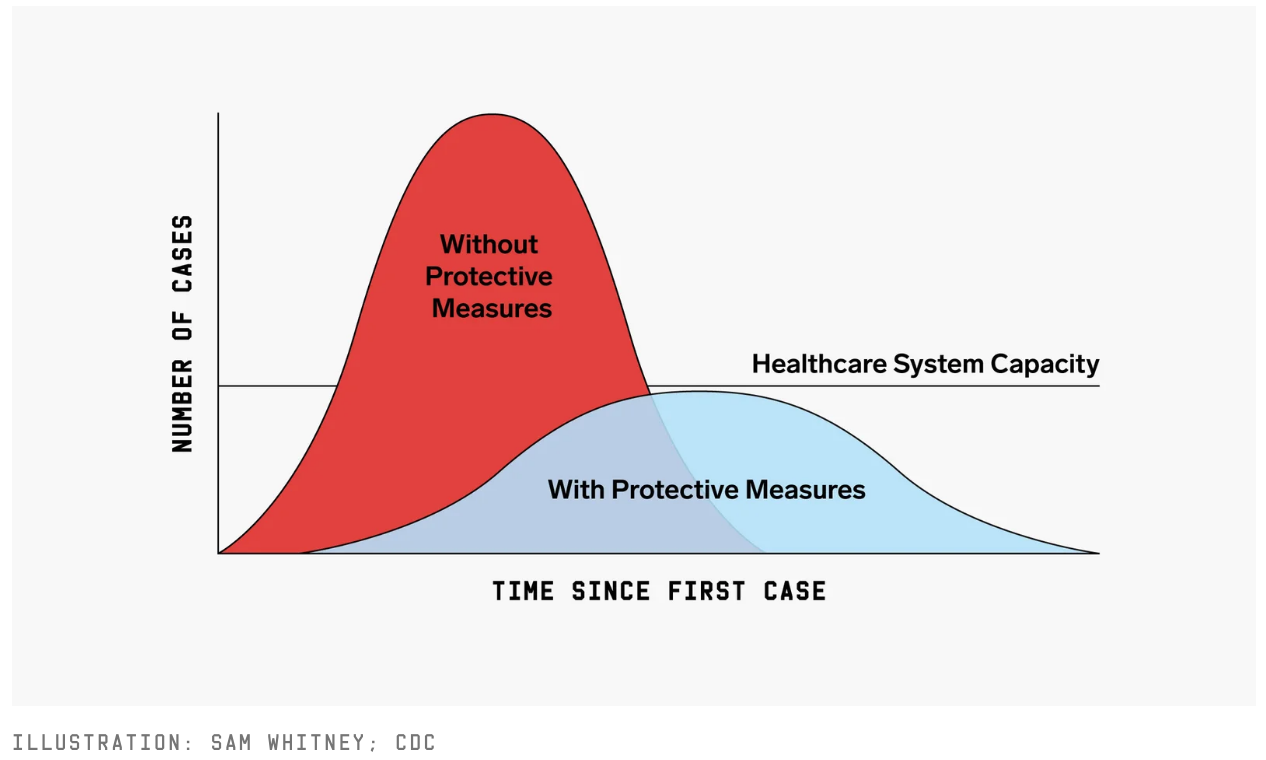
You’ve no doubt seen the chorus of people talking about “flattening the curve” (graphic below).
The prevailing narrative, and corresponding government action, can be inferred as follows:
At its current pace the spread of COVID-19 will overwhelm global healthcare systems. The resulting loss of life would be so great that governments should do anything and everything to curb fatalities, regardless of consequential economic damage.
But how many lives? And at what economic cost? We should examine data from China (base case), South Korea (bull case), and our own CDC so we might arrive at more educated answers to these questions.
COVID-19 Fatality Data from China, South Korea, and USA
We’ll begin with graphics from China and South Korea.
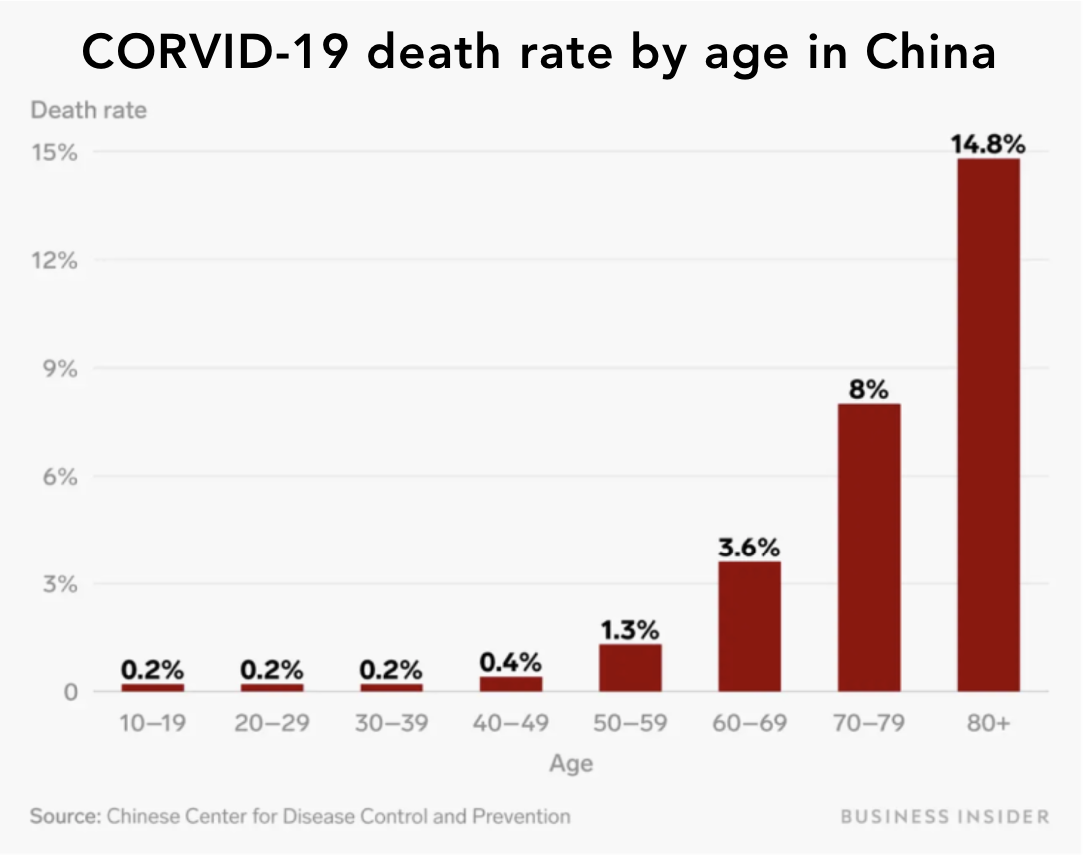
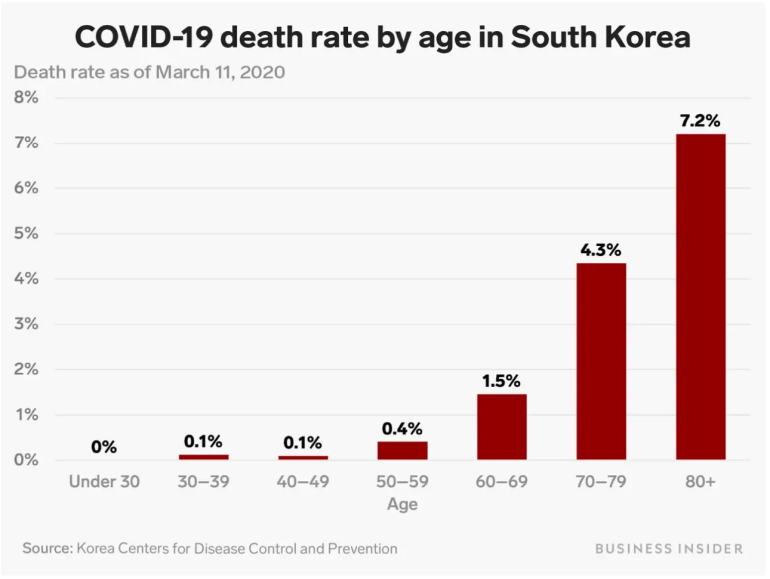
South Korea has experienced a drastically lower CFR. I don’t know if that’s because their population skews younger and healthier, they have more westernized health care and infrastructure relative to China, or their aggressive testing slowed the spread / demonstrated a more accurate CFR through expanding the denominator. What I can conclude is that the CFR is clearly higher as people age.
Unfortunately I wasn’t able to find good data on Chinese and South Korean hospitalizations by age group. I was able to find fatality rates based on the severity of the patients presented in China, however:
“Most case patients were 30 to 79 years of age (87%), 1% were aged 9 years or younger, 1% were aged 10 to 19 years, and 3% were age 80 years or older. Most cases were diagnosed in Hubei Province (75%) and most reported Wuhan-related exposures (86%; ie, Wuhan resident or visitor or close contact with Wuhan resident or visitor). Most cases were classified as mild (81%; ie, nonpneumonia and mild pneumonia). However, 14% were severe (ie, dyspnea, respiratory frequency ≥30/min, blood oxygen saturation ≤93%, partial pressure of arterial oxygen to fraction of inspired oxygen ratio <300, and/or lung infiltrates >50% within 24 to 48 hours), and 5% were critical (ie, respiratory failure, septic shock, and/or multiple organ dysfunction or failure) (Box).1
The overall case-fatality rate (CFR) was 2.3% (1,023 deaths among 44,672 confirmed cases). No deaths occurred in the group aged 9 years and younger, but cases in those aged 70 to 79 years had an 8.0% CFR and cases in those aged 80 years and older had a 14.8% CFR. No deaths were reported among mild and severe cases. The CFR was 49.0% among critical cases. CFR was elevated among those with preexisting comorbid conditions—10.5% for cardiovascular disease, 7.3% for diabetes, 6.3% for chronic respiratory disease, 6.0% for hypertension, and 5.6% for cancer. Among the 44,672 cases, a total of 1716 were health workers (3.8%), 1,080 of whom were in Wuhan (63%).”
The element that stood out to me (I bolded it above) was that nobody classified as “severe” died. Is that because they received adequate medical care before hospitals become overrun with the infirm, or would they have survived on their own without medical intervention? This matters greatly because the notion of “overwhelming the health system” is ultimately based upon severe cases leading to fatalities. We’ll get to this math later in the article, but let’s wrap up the CFR analysis with the latest mortality data published by the US CDC.
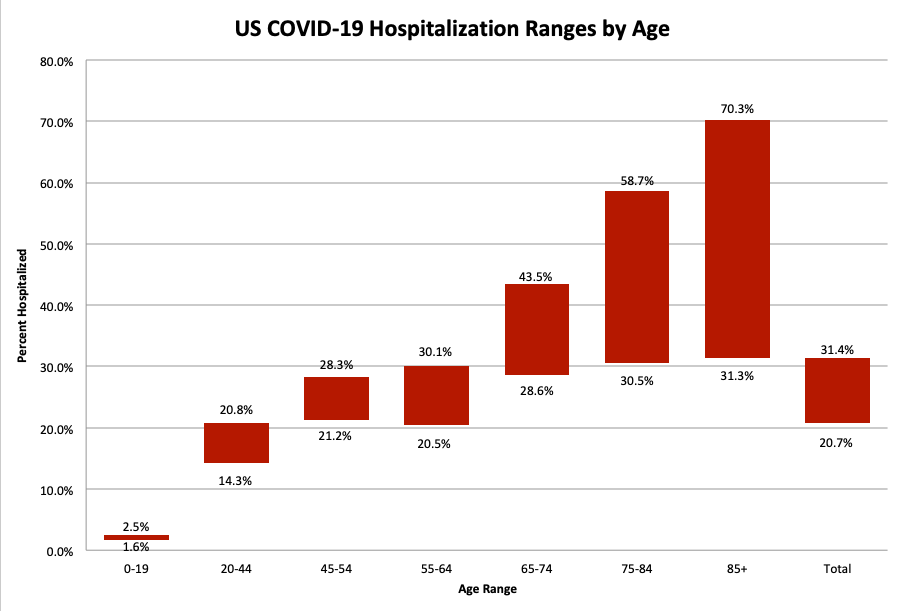
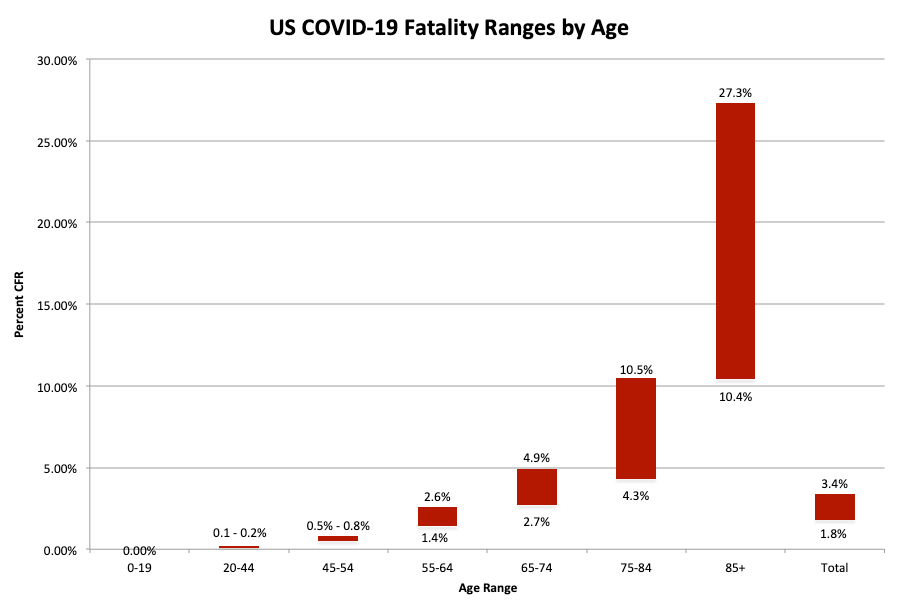
The CDC published ranges for hospitalization, ICU admission, and fatalities across age groups. I found their visuals insufficient so I created my own below.

The Real Expected Ranges of COVID-19 Fatalities In America
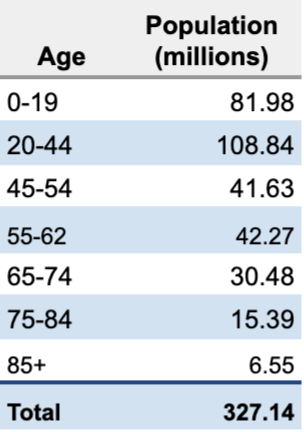
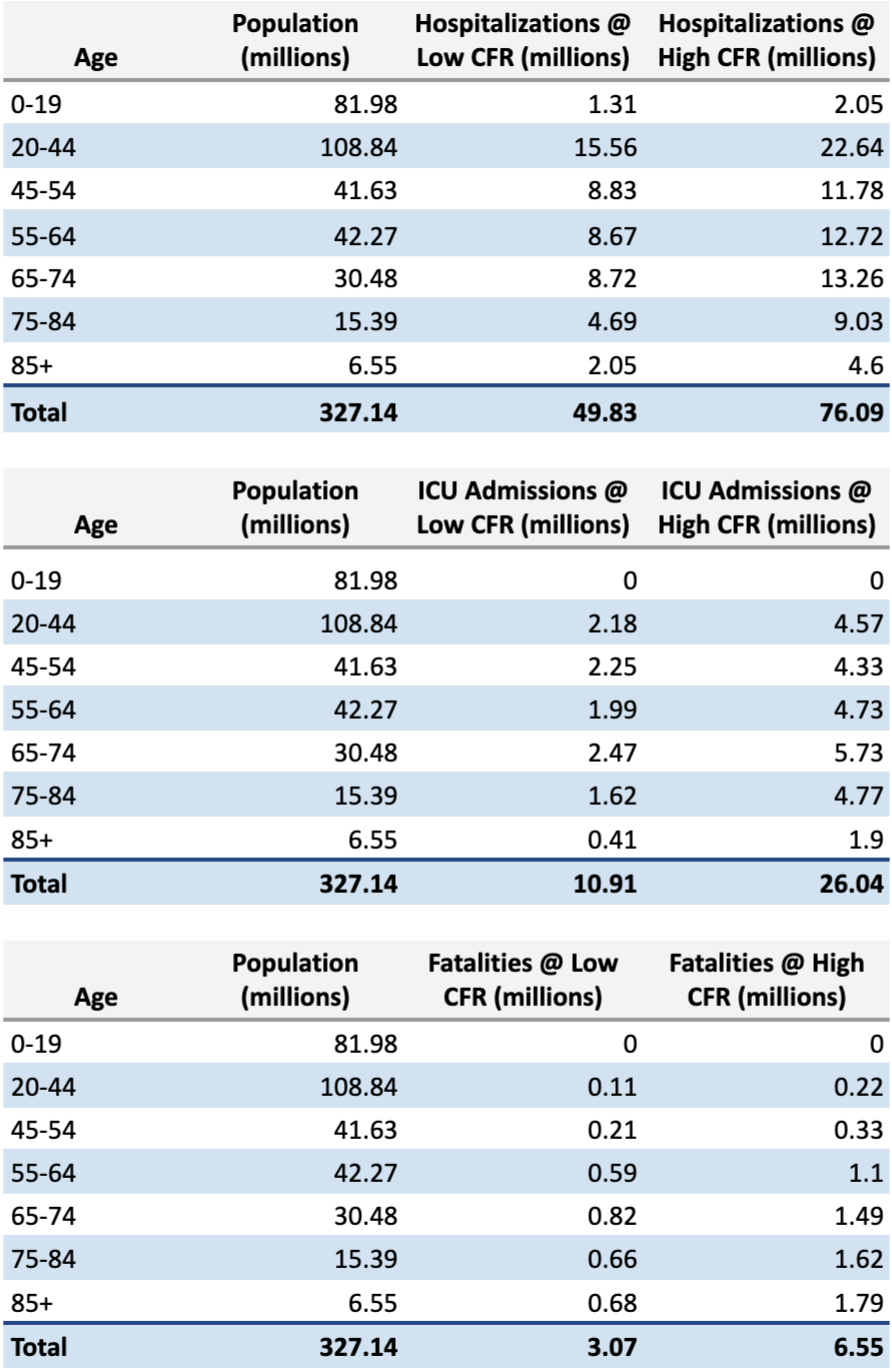
To transition from percentages to numbers of people we need to pull US population data by age group and aggregate them to align with the age ranges reported by the CDC.
Now let’s use the CDC hospitalization, ICU admission, and CFR ranges to predict the best case and worst case for each of the metrics assuming a 100% population infection rate (i.e. every American contracts COVID-19). More evidence is appearing daily that points to a much lower infection rate in reality (a 1-5% risk of contracting COVID-19 even when in direct contact with an infected individual, and an upper bound infection rate of 20 – 60%) but we’ll go ahead and ignore that for now so we can create higher end (worst case) fatality numbers.
We multiply the CDC’s CFR rates by the number of Americans in each age group to arrive at the following table:
The CDC, however, paraded out their own numbers and they were nowhere near my numbers, which as I’ve shown are directly calculated by multiplying the CDC’s empirical data on US COVID-19 infections by the number of Americans in each age group. Quoting from the New York Times article where the CDC’s most recent fatality estimates are found,
Between 160 million and 214 million people in the United States could be infected over the course of the epidemic, according to a projection that encompasses the range of the four scenarios. That could last months or even over a year, with infections concentrated in shorter periods, staggered across time in different communities, experts said. As many as 200,000 to 1.7 million people could die.
New York Times summary of CDC data
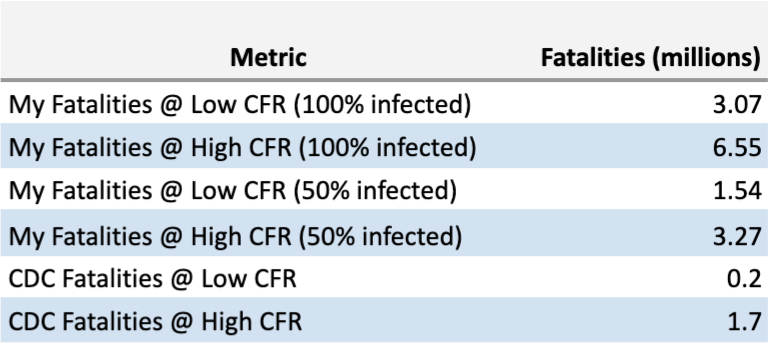
I can see the 160 million to 214 million being the estimation that anywhere between half (50%) to two thirds (66%) of Americans contract the virus, but even then I don’t see how their numbers jive. If we take my fatality numbers and adjust them for 50% and 66% infection rates we arrive at a fatality range of 1.5 to 2 million (lower range based on CDC’s CFR estimate of 1.8%), and 3.3 to 4.4 million (upper range based on CDC’s CFR estimate of 3.4%), respectively.
So what gives? Is the difference due to quarantines – that quarantines drop fatalities by up to 61% (found by dividing the CDC’s highest fatality number of 1.7 million by mine of 4.4 million)? I don’t know, but let’s go ahead and put the numbers in a table so we can compare the approaches for our next step: putting an economic value to a COVID-19 fatality.
How Governments Economically Quantify Human Life
I’m jumping back to history for a minute to provide context for how economically destructive the current policy of mass quarantine is, especially in relation to past government intervention/policy.
Governments and private industry alike have long made decisions on the implied economic value of human life. Speed limits, consumer product releases, and construction projects are some of the many such examples.
For instance, when a plane crash causes casualties, families of the deceased sue. The first payout comes from liability insurance carried by the airline, which is around $170,000 per passenger set by the Montreal Convention. If the airline was at fault, the numbers can be higher – $2M per passenger was the highest amount I found. But that requires someone to prove negligence, which can be rather hard to do. For example Boeing, the manufacturer of the Boeing 737 Max that crashed and killed 346 people across two flights, set aside $50M to pay out families in addition to the airline payouts. That works out to another $145,000 per passenger, but it’s not $2M.
These numbers need to be reasonable because all entities – namely our current government – have limited resources. Studies have shown that the average American pulls $2.7M in lifetime, pre-tax earnings. There’s an entire table of lifetime income here, created from 2018 tax returns, but the average (median) annual pre-tax income is $50,000 per American, starting around age 35 and persisting until about age 75, after which it falls as Americans most likely die or retire.
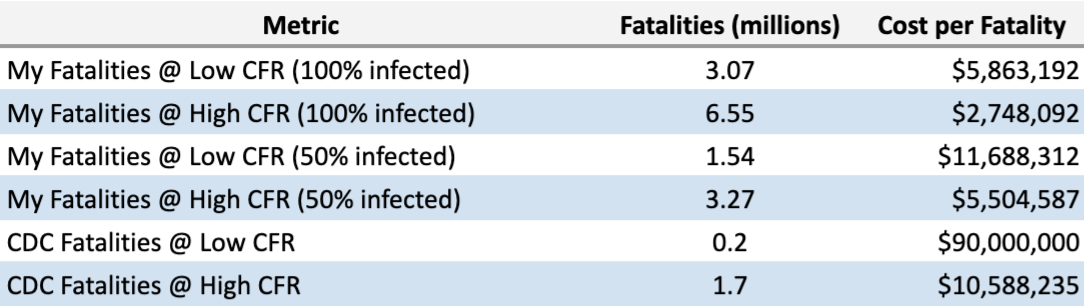
Thus far the mass quarantines across America have wiped $13T off the economy as measured by a 30% fall in the Russell 3000 (and the markets are still falling as of this writing). On top of this, our legislators are proposing at least another $1T in stimulus and bailouts, and a $4T business loan program. Most businesses will never be able to repay these loans (more on that later), so let’s go ahead and state the total US market damage as it stands today as $18T. Now we need to divide this by the number of expected fatalities to come up with an economic value per fatality. I’ve gone ahead and put that into the table below.
We should make one more adjustment to this data to make it economically consistent with how both governments and private industry perform their analysis: weight it by age.
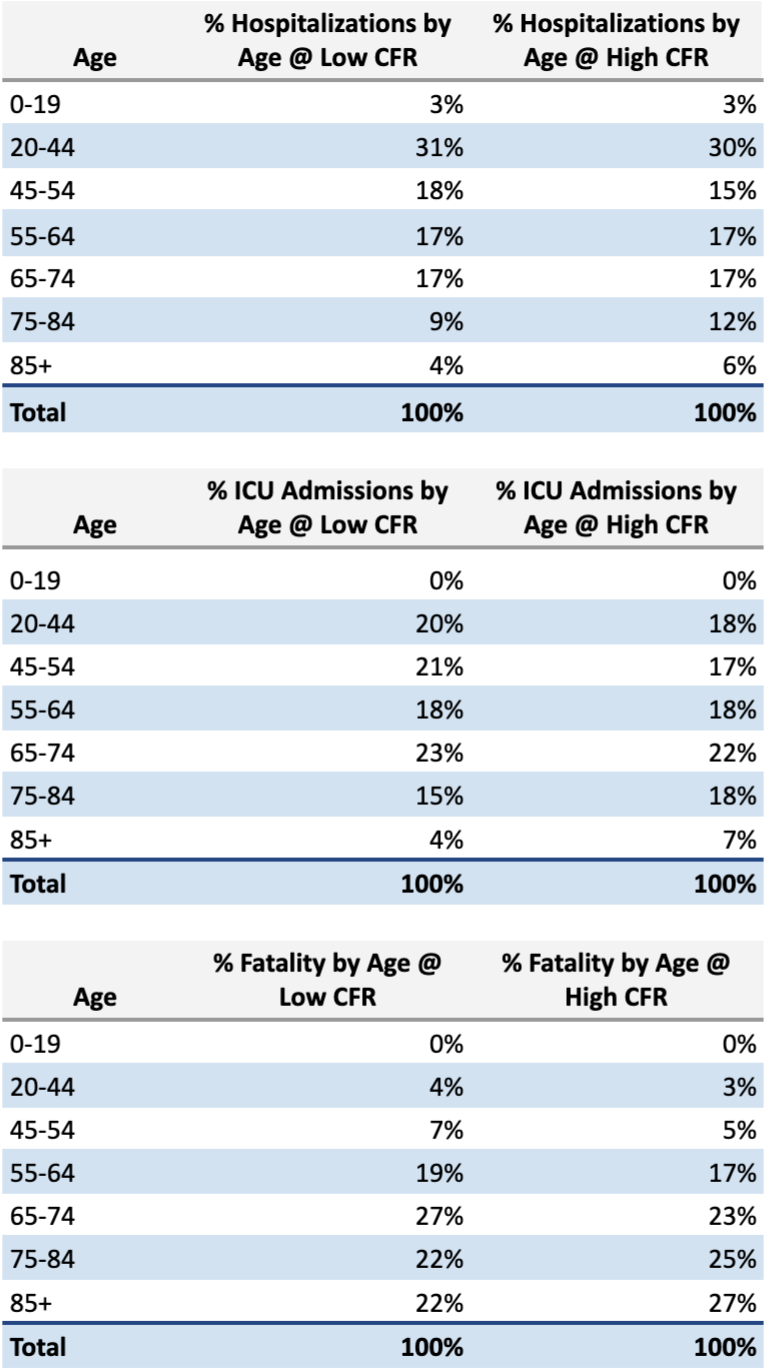
Revisiting our earlier charts we can see that the over-65 crowd comprises a large percent of the hospitalizations (31%-35%), ICU admissions (41%-48%), and fatalities (70%-75%). I created a table that turns each group into a percentage of hospitalizations, ICU admissions, and fatalities.
We need to make such an adjustment because older people have less earning power as years of earned income are already behind them, and it’s the same consideration governments and private industry employ in their own decision making. The appropriate method is a weighted average approach. We will assume we die at 85 years of age and each year of pre-tax income is $50,000 as a median value. We’ll set the maximal value to $2.7M.

To quickly explain the chart below, if you died of COVID-19 at age 19 you have your whole life ahead of you, so you would miss out on $2.7M of potential pre-tax income. If you died at 80, you’d only have 5 years of pre-tax income remaining at $50,000 per year, so that becomes $250,000. In using a weighted average we multiply these incomes by the percent contribution of fatality for each age group as a function of total fatalities across all age groups.
After these adjustments we can see that the average economic value per life is lower than $2.7M as it’s being skewed by higher CFRs for older age groups who have lower remaining pre-tax income potentials. We should now divide the $18T by the pre-tax weighted average incomes of $705,641 (low CFR scenario) and $618,064 (high CFR scenario).
The $18T in observed market decline would therefore be equal to an economic loss of between 25,508,722 and 29,123,198 Americans, drastically higher than anything we or the CDC has projected.
And what if we exclude the fatalities from the over-65 age groups? Instead of a mass quarantine, what if those 65 and older quarantine themselves, similar to what America did during past pandemics? If we are able to effectively quarantine/safeguard the 65+ age group we should be able to more efficiently minimize both sustained mortality rates and economic impact, averting a depression. I’d note that the infirm should also quarantine themselves but that is a bit harder to model out.
Under my proposed selective quarantine, today’s economic damage shouldn’t be attributable to any of the fatalities in the over-65 age groups because, as we’ll assume for easy math, nobody over the age of 65 dies as a result of our proposed quarantine. What we’re left with are the minimal projected deaths exclusively from younger age groups who continue to operate the economy: hotels, bars, restaurants, retailers, and other local businesses stay open and generate tax revenue with payrolls, even if there’s a bit of a revenue drop as the 65+ age group stops patronizing businesses as frequently. (Note that 15% of the country is age 65 and older, so business revenue impairment would not be as severe as it is under a mass quarantine).
Now we should revisit our cost per fatality table to see the economic damage per fatality with the 65+ age groups removed. This will hopefully clarify how economically irresponsible current policy is – especially in comparison to my proposition.

These figures essentially show the economic cost of mass quarantines as opposed to limited quarantines of the old and infirm, and they’re really high, especially if we use the CDC’s numbers.
The Worst Case: How Many US Hospitalizations Become Fatalities?
Remember my earlier observation that mass quarantines are based on the assumption that without quarantine there will be a rapid spread of COVID-19 that will overwhelm our healthcare system and result in higher death rates? Well, if CDC is projecting 1.7 million deaths as a worst case (and we don’t know if this is with or without quarantine, but we’ll get some answers later in the article) you’d need to believe that between 77% and 183% of all ICU admissions result in fatalities.
Since you clearly can’t have an ICU fatality rate over 100% you’d need to believe that non-ICU hospitalizations also result in death. Doing the math, you’d need to believe that upwards of 45% of all COVID-19 hospitalizations result in fatalities, which has not been demonstrated in any data set I’ve seen.
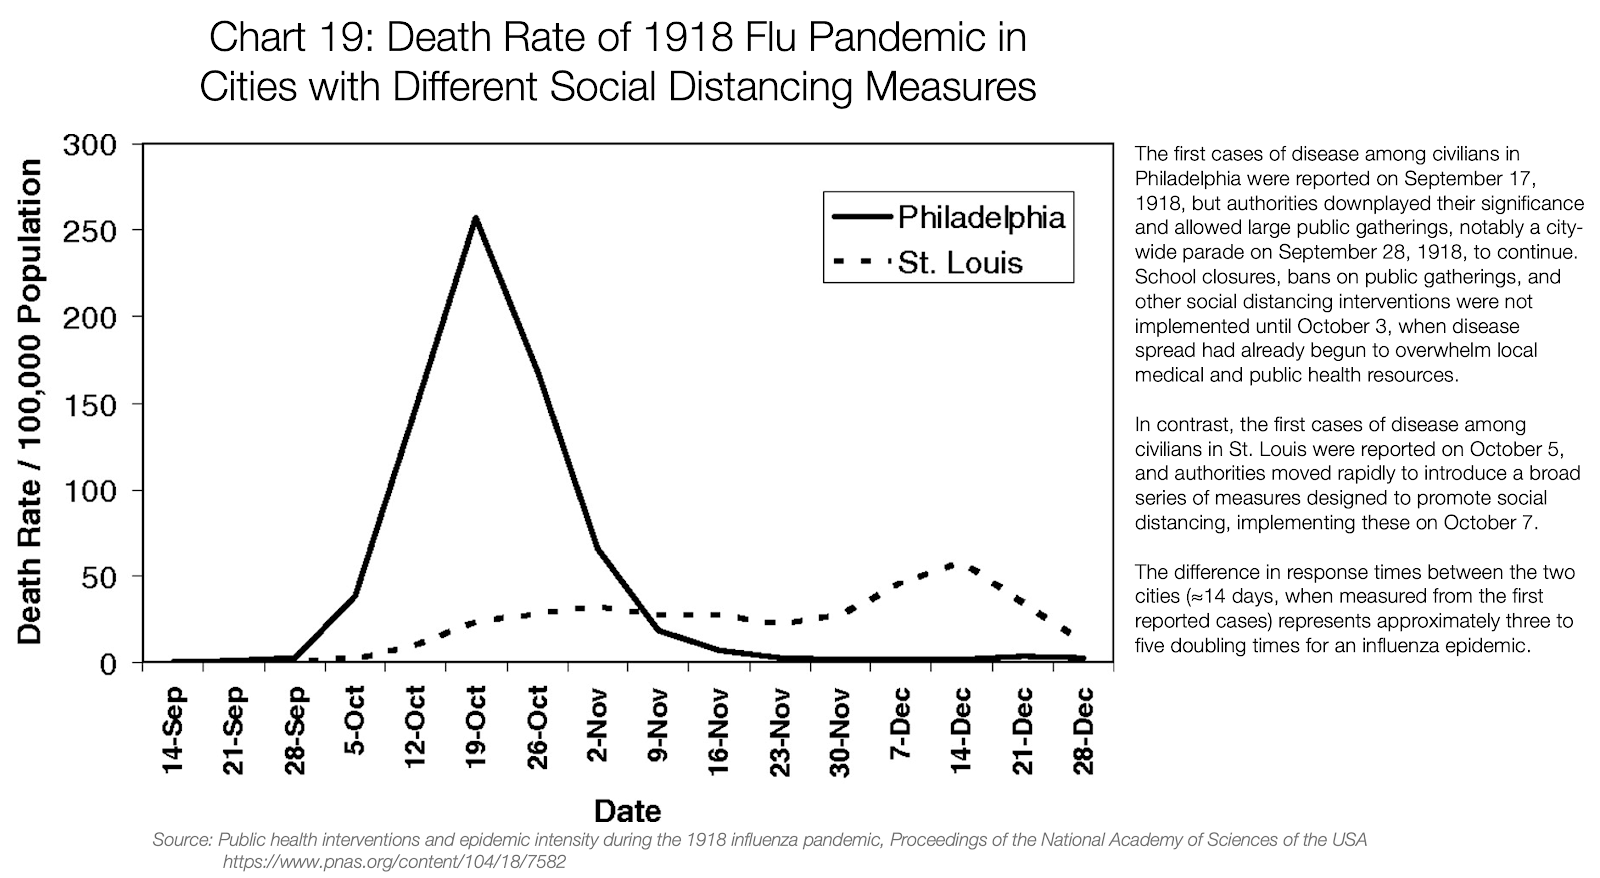
Even if we look at the recently-popular graphic purporting to show the difference in fatalities between two US cities during the 1918 flu pandemic, the peak fatality rate for Philadelphia, which we’re told didn’t emphasize social distancing, is 0.25% – roughly double what it is for today’s seasonal flu. This is without modern medicine and technology, and it should be noted that nearly a quarter of Philadelphia’s health care workers were called away to help with the war efforts while Philadelphia’s population in 1918 was nearly triple that of St Louis, making any communicable disease more contagious through physical proximity. I’d bet that subtracting out the over-65’s and otherwise infirm would drop Philadelphia’s CFR to less than the CFR for seasonal flu. In fact, if we use the CDC’s COVID-19 fatality statistics as our baseline, their data suggests that between 70% and 72% of all fatalities are from the over-65 age groups. Therefore the peak CFR for Philadelphia would have been no more than 0.075% if the over-65’s were removed.
If we remove the over-65’s from our own fatality calculations we should readjust the remaining pre-tax income potentials to more accurately reflect a younger average COVID-19 fatality, just as the government or private industry would do. Remember, older age groups have lived through most of their prime income earning years, meaning that removing them will increase the average economic loss per fatality. That new table is below – note that I’ve not removed the 0-19 age group despite accounting for 0 fatalities.
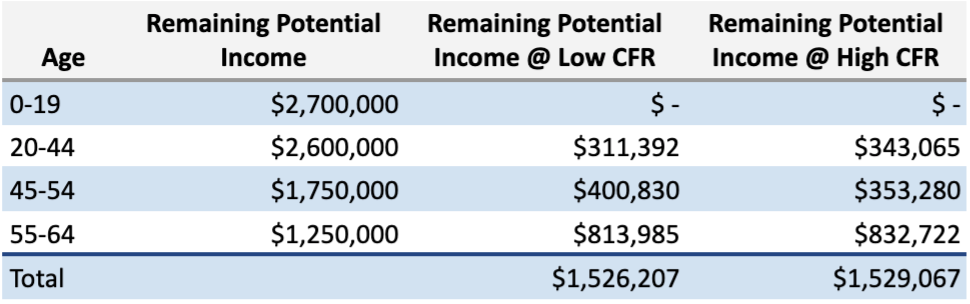
Now we divide the $18T by these values and we get a fatality range of 11.77 million to 11.79 million people, all of whom would be under 65 years of age. We estimated that there would be between 6.41 and 13.64 million Americans of these ages in the ICU, which means you’d need to believe that between 86% and 184% of all admitted ICU patients in these age groups die. And again, because you can’t have more than a 100% fatality rate for ICU patients you’d need to believe that upwards of 34% of all COVD-19 hospital admissions for those under the age of 65 result in fatalities.
But that sounds like cognitive dissonance when, per China’s report, “No deaths were reported among mild and severe cases,” and even the latest modeling from Imperial College (table below) shows that COVID-19 hospital admissions don’t result in these rates of ICU admissions or fatalities from younger age groups.

Current COVID-19 Economics Per Fatality
The responding government action should be proportional to the true economic implications of COVID-19. Where does all this analysis leave us?
If governments assume each person has an economic value of $2.7M based upon their median, lifetime pre-tax income, then current COVID-19 economic impact is equal to 6.67 million Americans fatalities.
If governments employ a weighted average to calculate potential pre-tax income by age of death, then current COVID-19 economic impact is equal to between 25,508,722 and 29,123,198 American fatalities.
And if governments exclude the over-65’s from the fatality counts, then current COVID-19 economic impact is equal to 11.8 million Americans fatalities under the age of 65.
All of these scenarios far exceed the CDC’s fatality projections.
To summarize this analysis I’ve created three handy graphics. The first graphic calculates the economic cost per fatality with varying infection rates using the CDC’s high CFR of 3.4% and low CFR of 1.8% without mass quarantine.

The second graphic calculates the economic cost per fatality with varying infection rates using the CDC’s high CFR of 3.4% and low CFR of 1.8% under a selective quarantine scenario. We assume nobody over the age of 65 dies as a result of the selective quarantine.

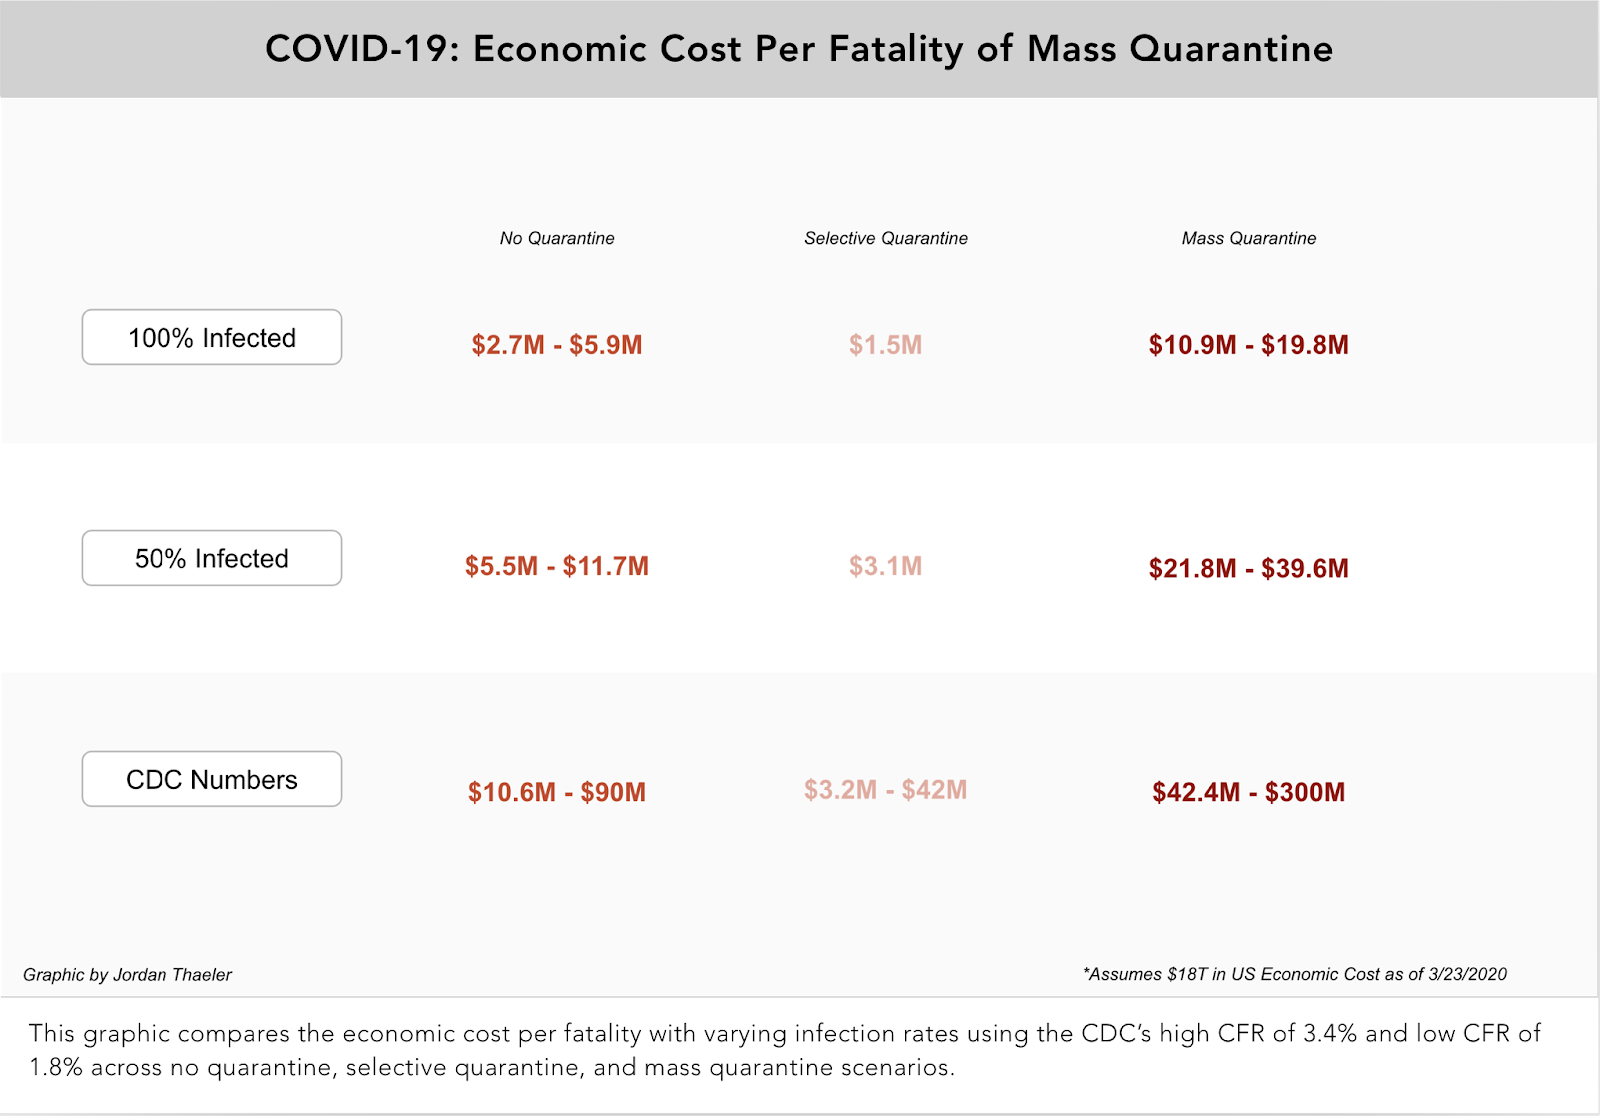
The third graphic compares the economic cost per fatality with varying infection rates using the CDC’s high CFR of 3.4% and low CFR of 1.8% across no quarantine, selective quarantine, and mass quarantine scenarios.
How Many Lives Will “Curve Flattening” Save?
This gets me to my next point, which is that none of the CDC data quantifies the value of mass quarantines except for the vague “flatten the curve” speak. The best data I was able to find in this regard comes from the Imperial College COVID-19 response team. This team looked at two different approaches: mitigation (keeping home the at-risk populations and quarantining the infected) and suppression, which I’m defining as the mass quarantines experienced by most of us around the globe today. The group modeled that mitigation would reduce healthcare demands by two thirds and deaths by half. Mitigation is what societies turned to during the 1918 Spanish flu pandemic as well as the influenza pandemics of 1957, 1968, and 2009.
Assuming no change at all to normal behavior, the Imperial College team projected 2.2M US fatalities. Below are their graphics, lifted directly from their report. They predict a peak in fatalities around 3 months but are fair in noting that they’re not accounting for other deaths that may come as a byproduct of an overburdened healthcare system.

The team then modeled varying degrees of impact based on the types of mitigation employed, demonstrating the quantifiable impact of these measures.
They defined the following types of mitigation accordingly:

Do you know what mitigation measures Imperial College researchers found to work best?
“..the most effective combination of interventions is predicted to be a combination of case isolation, home quarantine and social distancing of those most at risk (the over 70s). Whilst the latter has relatively less impact on transmission than other age groups, reducing morbidity and mortality in the highest risk groups reduces both demand on critical care and overall mortality.”
Doing this would reduce their predicted 2.2M American deaths to 1.1M. To be consistent with government and private industry economic analysis of each fatality, dividing the $18T by 1.1M fatalities yields an economic cost per fatality of $16.4M.
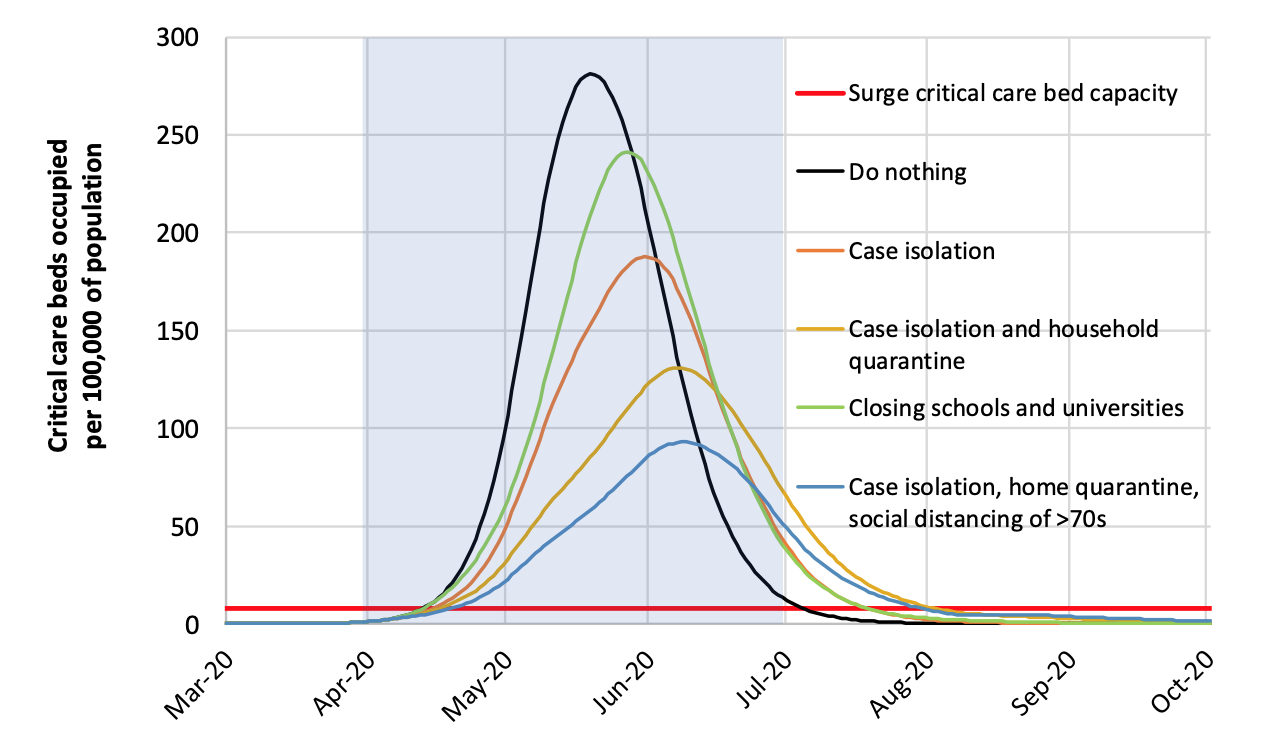
A final summary graphic of the reduction of deaths between the do-nothing, mitigation (what we call selective quarantine), and suppression (what we call mass quarantine) approaches was modeled out as follows in the Imperial College findings:
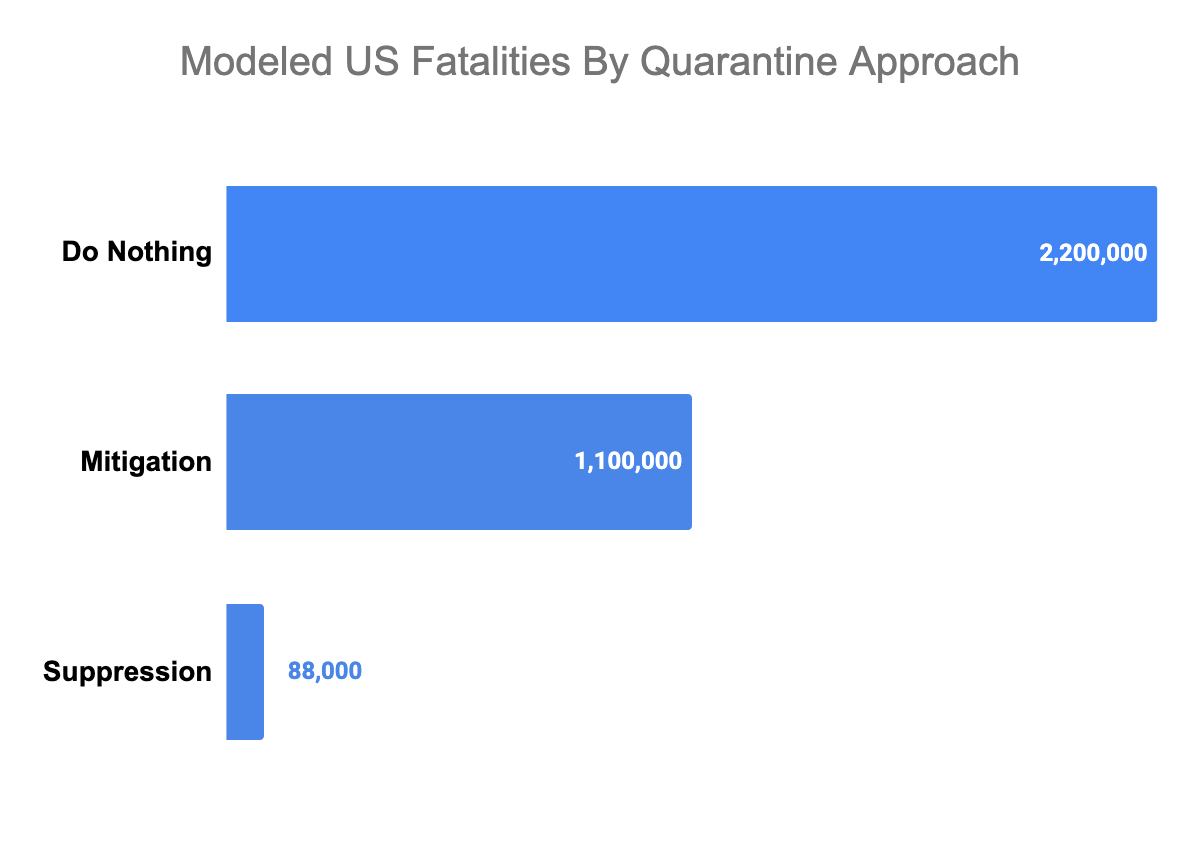
The True Cost of Mass Quarantines
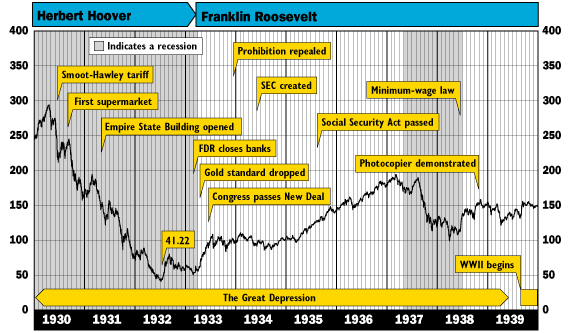
Even so, I actually don’t think that global governments are done with their market destruction, and that $18T in economic damage will look like a dream if these mass quarantines are perpetuated. For reference, during the last American depression (1930’s) the Dow Jones Industrial Average fell 90% from its peak and only managed to recover 50% of its losses over the next decade. This will be an important benchmark to remember when we talk about unemployment later.
In China, Apple and Starbucks shuttered stores for 6 weeks. Lord only knows what type of containment measures an authoritarian regime like China implemented to compress the quarantine into such a short timeframe, although there are some online videos that might give us a glimpse. In America, 6 weeks feels like a best case scenario, and President Trump is on record saying that this could last until July or August, which is 4-5 months away. The Imperial College report recommended that suppression strategies would need to be in place for 5 months or longer. But by then it will be too late for a large percentage of American businesses.
The US economy employs 155 million people. There are an estimated 5-10 million job openings, so you could say that full employment would be 165 million Americans, or about half the population.
The US restaurant industry directly employs 15 million people. There are undoubtedly another 5-15 million hanging around the basket supporting the industry as suppliers – think technology companies, real estate companies, financiers and accountants, and directly the food and beverage suppliers / distributors. This industry is a day-to-day cash business. These companies, by and large, have no balance sheet to employ people or even pay rent without cash flow. They’re certainly not going to be able to repay trillions in government loans. We’re talking about a 5% margin business in good times, and an annual failure rate of 17% that’s probably closer to 30% once you remove the chain operators who skew this calculation.

Below is a table of the number of US restaurant locations by location count, reworked from NPD data. Those one-store companies – half the US restaurant market – definitely have no balance sheet. The 2-9 store category are small franchisees at best, and they don’t have a balance sheet either. I feel comfortable saying that 75% of the restaurant industry cannot support more than eight weeks of zero revenues. We’re currently in week two of our formal quarantine and some of the most seasoned and experienced restaurant groups are already making 80% staff reductions.
Sure, some large corporations like McDonald’s, who operate a minority of their stores and are mostly branded real estate holding companies, would survive, but what about their franchisees? Most of them would need access to credit to survive, and no financier could reliably predict revenues in a depression. The National Restaurant Association is predicting a 25% drop in expected annual restaurant revenues ($225B) over the next three months, but I didn’t see any considerations given to two major points:
- A large percentage of restaurants cannot afford three months of no, or delivery-only revenue
- Revenues won’t simply rebound to pre-COVID-19 levels when restaurants are back open as fewer people are employed and dining out is one of the first luxuries cut
These two considerations mean that projected 2020 restaurant revenues will surely collapse by more than the $250B being predicted.
Separate from restaurants but part of hospitality, the US hotel industry employs a further 2.3 million people. The American Hotel & Lodging Association reckons that the industry supports another 8.3 million jobs indirectly. Like the restaurant industry, the hotel industry is primarily driven by individual entrepreneurial franchisees, many of whom also lack a balance sheet ‘cookie jar’ to draw from. To quantify the precipitous drop, Marriott is reporting occupancy rates (a key measurement of how full a hotel is) below 25% – down from 70% last year. In mainland China, occupancy rates are reported to be as low as 5-6%. Unfortunately, the buck doesn’t stop here as hotels are highly leveraged, which in itself will cause financial waves as billions of dollars in loan obligations go unmet.
Airlines for America estimates that the domestic airline industry comprises over 10 million jobs, both directly and indirectly. It wasn’t even a week from the first American COVID-19 case before the airlines started asking for money – $50B for starters, mostly because they’ve depleted their balance sheets through share repurchases over the past decade. Regardless, they know they can’t support zero revenues for a prolonged period either given their financial situations.
The retail industry supports 25% of American jobs per the National Retail Federation. In the COVID-19 crises grocers will do fine, but they employ a relatively small 3 million people. The rest of retail will be a bloodbath. It’s hard to get a real handle on how retail employment is defined, with numbers from 29 million direct jobs to total direct and indirect employment of 42 million. Still, I think it’s fair to assume that half the retail jobs are at-risk in the immediate future; we’ll call that 15 million jobs.
My base case assumes 10 million restaurant and hotel jobs disappear, another 5 million from the airline industry go away, and retail loses 15 million jobs. Adding these together gets me to 30 million jobs lost, and I’m not even including the fact that this will ripple through the economy with a vengeance – finance, construction, healthcare, energy, transportation – everything will suffer when 30 million more Americans have no income.
And then we need to consider loss in worker productivity. Mass quarantines are closing schools, meaning that even “essential” workers who might otherwise go into work at your local power plant or wastewater treatment facility are struggling to figure out who will watch their children. When people who are accustomed to reporting into an office start working from home productivity is going to fall dramatically, especially if they’re needing to watch their children all day. The BLS reports that nearly 91% of families with children have one parent who works while 63% had both parents employed. There are an estimated 34 million families with at least one child, which means productivity should be expected to fall for 24.1 million workers since at least one parent will need to watch the children during the workday. How long can companies really afford to keep these 24.1 million on payrolls as their work output falls and business revenues decline from swelling unemployment?
There are roughly 6 million unemployed Americans today. Solely adding my 30 million directly-lost jobs gets us to 36 million unemployed in short order. That new unemployment rate now becomes 22%, and that’s just the beginning. During the Great Depression unemployment rates peaked at 25%. Peaked. And look at the economic devastation. Quoting from an article on the Great Depression,
“The Great Depression of 1929 devastated the U.S. economy. Half of all banks failed. Unemployment rose to 25% and homelessness increased. Housing prices plummeted 30%, international trade collapsed by 65%, and prices fell 10% per year. It took 25 years for the stock market to recover… During the first five years of the depression, the economy shrank 50%.”
My 22% unemployment rate is a base case and doesn’t even account for the collateral damage as the purchasing power of 30 million more unemployed Americans vanishes in the economy. The 25% unemployment rate seen during the Great Depression would be a Sunday picnic by comparison.
That’s a long way of saying the $18T wiped from our markets today could be a drop in the bucket if mass quarantines cause economies to pick up downward momentum. 58% of Americans are hourly workers and 60% of the population has less than $12,000 in savings (median value). Excluding mortgages, the average American is carrying somewhere north of $38,000 in debt and only 23% of Americans say they’re debt free. Suspend their income and a large percentage of the population declares bankruptcy.
We really need to consider the full tradeoff we’re signing for with mass quarantine. While it may prove helpful in the short term (again, I’m no epidemiologist) the public needs insight into how this decision is being made to avoid more economic turmoil.
Herd Immunity And The Perpetual Quarantine: It Might Actually Last 24 Months
Let’s say our mass quarantine lasts until July. My predictions come true and we have over 20% unemployment. Our government has already dropped Federal Reserve rates to zero, effectively neutering monetary stimulus (i.e. rates cannot practically go lower). All that’s left is fiscal stimulus: printing money to buy assets, but even then the market isn’t elastic enough to reabsorb those 20% unemployed. Okun’s Law tells us that a 1% increase in unemployment is equal to a 2% decrease in GDP. In 2019 our GDP was $21.4T, meaning a 22% unemployment rate would require an annualized fiscal stimulus of $9.4T (calculated by multiplying our GDP of $21.4T by the product of 22% unemployment and 2% GPD loss per unemployment percentage). That’s more than double America’s inflation-adjusted cost of World War 2, which was only $4T… and that was over a four year period of global warfare.
Per earlier modeling let’s assume that the number of new COVID-19 cases is receding in July, and staring at the economic data the government decides it’s best to lift quarantines to try and kickstart the economy by freeing people to spend money. Those still employed return to their normal patterns, albeit carefully.
Then we have a COVID-19 rebound.
Without herd immunity the population is still “at risk” and the government decides to be consistent with previous behavior and orders another mass quarantine.
I’ve not found one epidemiologist who says that a quarantine prevents COVID-19 from reemerging. In fact everything I’ve read says quite the opposite.
My concern right now is that we are going to have a major epidemic now across the United States. There are different estimates of how long that is going to last, but most of the modeling shows that it is most likely to peak sometime in probably late April or early May. That is sort of the optimistic case. In seven to eight weeks the epidemic will peak. Then it will start to come down. By July, hopefully the epidemic will have coursed. There will be a sizable portion of the population who have gotten the infection so you’ll have what’s called herd immunity. In July and August, we’ll probably have sporadic outbreaks but you shouldn’t have epidemic spread. The fear is, and my concern is, that when you come back in September, you’re going to have major outbreaks and the risk of another epidemic going into the winter. I think the policymakers really need to focus on that risk. That’s a challenge because right now they are focused on the crisis. But they need to take steps right now to also be guarding against the risk in the fall. By September, it will be too late.
Dr. Scott Gottlieb, former commissioner of the Food and Drug Administration
So this cycle of mass quarantines repeats itself until you have herd immunity or a vaccine, the latter of which could take 18-24 months. And remember, herd immunity only applies if enough people are exposed to the virus; a mass quarantine pretty much guarantees the opposite. Per the linked National Geographic article,
“Research so far suggests that the coronavirus has a lower infection rate than measles, with each infected person passing it on to two or three new people, on average. This means that herd immunity should be achieved when around 60 percent of the population becomes immune to COVID-19.”
How are 60% of the population going to become infected if they’re all secluded indoors? This is why it seems logical to disagree with Dr. Gottlieb’s comments around herd mentality developed between now and July. Even the Imperial College report notes that a suppression requires a steadfast adherence to mass quarantines to prevent relapses until a vaccine is developed,
“To avoid a rebound in transmission, these policies [suppression / mass quarantines] will need to be maintained until large stocks of the vaccine are available to immunise the population – which could be 18 months or more… if intensive NPI (non-pharmaceutical intervention) packages aimed at suppression are not maintained, our analysis suggests that transmission will rapidly rebound, potentially producing an epidemic comparable in scale to what would have been seen had no interventions been adopted.”
The Imperial College position is supported with their below visual, showing a second peak (i.e. epidemic) from late October to mid February after today’s quarantines are lifted and we’re anecdotally hearing about COVID-19 resurgences from places in Asia that have already weathered the first wave.

The question then becomes: do we continue mass quarantine – now understanding the economic impacts – considering a relapse of similar proportions is likely to occur? Furthermore, I’m not confident that the government can feasibly keep the economy at pre-COVID-19 levels until a vaccine presents itself. I’m not trying to be an alarmist, but it’s not hard to model unemployment rates of 50% or more if mass quarantine continues to put small businesses underwater.
What Should Governments Do?
What should governments do?
1. Work with private industry to build more ICU beds and ventilators.
A worst case Harvard study predicts America would need a few hundred thousand more ICU beds… but only if the over-65 age group doesn’t quarantine themselves. Remember that the over-65’s represented between 41% and 48% of all COVID-19 ICU admissions per the CDC’s data. My proposal to safeguard the elderly via quarantine should hopefully mitigate these cases. For reference, our seasonal flu lands an estimated 18,000 to 96,000 in the ICU.
2. Suggest that at-risk age groups quarantine themselves and let everyone else develop herd immunity by living life like Americans have during previous pandemics.
My analysis doesn’t show nearly enough fatalities to justify an economic collapse of the magnitude governments are catalyzing through mass quarantines. Remember, if we remove the over-65’s and assume a 100% infection rate, the highest number of fatalities I could come up with for the under-65’s amounts to 1.65M Americans. The CDC’s own numbers come to a less spectacular 60,000 – 430,000 dead once you remove the over-65’s. If you want to compare lethality, here’s a table of the leading causes of American deaths per the CDC:
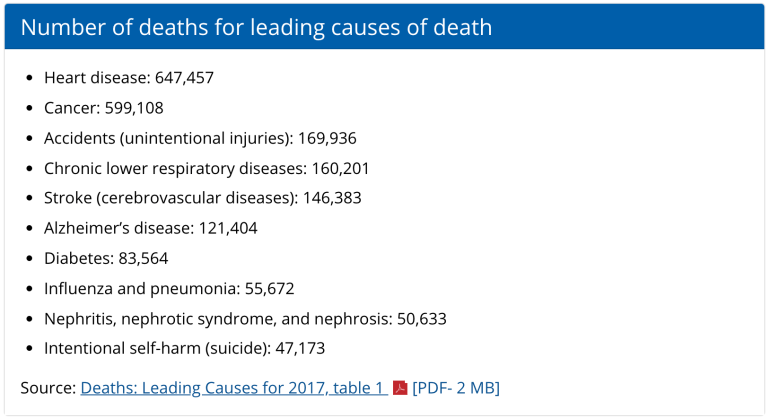
And this is all based on the CDC’s assumed upper CFR of 3.4%, which is entirely suspect until we have a denominator we can confidently stand behind. Per analysis I performed earlier, the CFR might actually be 0.55% at its highest, meaning that my worst case fatality count of 1.65M under-65’s might be overstated by 84%, and the true US fatality number could be closer to 267,000 deaths. And this still assumes 100% infection rates, which is looking less and less likely every day.
3. Expedite the trials of antivirals and other treatments
There appears to be a high promise of antivirals in treating COVID-19, ranging from Japanese drugs for influenza, to experimental antivirals developed for ebola, and even antimalarials. Governments should fast-track the use and observation of these treatments whenever patients so desire.
4. Share more data
I’ve seen no CDC data prognosticating the best and worst case outcomes based upon mass quarantines and no quarantines. I’ve seen no data demonstrating what happens to fatalities when the over-65’s and otherwise infirm quarantine themselves while the rest of us behave as our forebears did through previous pandemics. I’ve seen no data on the length of time we’re expected to live under mass quarantines, nor what economic tradeoffs Americans would be signing up for in following mass quarantines. Sadly, there’s been way better data and analysis coming from private citizens showing how disproportionate government responses to COVID-19 seem to be so far.
What Should You Do?
What should you do as a free citizen of your respective Republic / Democracy?
Ask your government to share their data and explain their decisions. Economies are in complete turmoil because nobody knows what government interventions to expect. I can think of three distinct answers everybody deserves.
- What are the fatality tradeoffs of mass quarantines – i.e. how do fatalities vary as a function of the length of time of mass quarantines?
- How long should we expect mass quarantines, and under what conditions will they be reconsidered once lifted?
- What amounts of economic damage are justifiable? Economic damage is directly related to the length of mass quarantines, so at what point do governments recognize the economic destruction as too great to perpetuate mass quarantines as a strategy?
If you’ve at all been economically impacted by COVID-19, or are living with economic uncertainty, sign this petition to ask that our government share their data regarding their policy of COVID-19 mass quarantine.


Preach, Jordan! Your point below is so under-analyzed and spot on. Why choke the patient when you can amputate the infected area?
“I suggest alternatively quarantining the 65+ demographic that is most susceptible to COVID-19 to mitigate loss of life, while allowing the economy to function, ultimately avoiding a depression.”
A very impressive piece of research in a crisis with not so much data to actually work with. The precision of the mitigation approach is the crux of it and I agree with the conclusions, and can’t see why anyone would argue with the petition’s premise that the government needs to share this data immediately and fully. I would comment that mitigation can take other forms as well. Since we know the genetic markers for the virus, any test that could return results within minutes – which should be doable – would also be a game-changer and would be far faster to develop, test, manufacture and deploy. Lastly, one other point you make is worth repeating – the government’s inability to project durations for any of this is a core aspect of the trillions in losses.
Basic leadership, don’t see any yet
Thank you for this! You’ve outdone yourself with this analysis
Jordan, you may get an early read on your proposed mitigation by age segment strategy courtesy of Russia, which has a quarantine on older citizens but nothing particularly suppressive going on elsewhere that it appears anyone is paying any attention to.
Also Sweden https://news.yahoo.com/lockdown-wait-sweden-goes-own-way-003057482.html